

Museum Money Grab
The Economic Case for Public Arts Funding

A century of data across 100 global projects reveals that cultural institutions do not just enrich a city’s cultural appeal and humanitarian enrichment — they dramatically outperform sports venues as engines of long-term economic return. The case for public funding of the arts has never been more empirically airtight, but that is not the only conclusion to draw from the data.
With the World Cup occupying too much of my headspace, I thought that I should release this bull I have sat on for a few months. It is not the usual connection of collections to the broader world, but rather a connection of the arts in general to the broader economy with a touch of #urbanplanning in a framework we all understand. Do not get the wrong idea, it is not that stadiums are wrong, it is that museums and culture are more right. I like this outcome because I do not want to feel that bad about liking sports too.
In 1976, the city of Montreal sauntered down Olympics road toward global recognition. As the symbol of the event, they envisioned an iconic stadium with a retractable roof that winks at the heavens. Instead, they birthed a concrete white elephant that ballooned from a projected $120 million to a staggering $1.5 billion. By the time the city finally paid off the debt in 2006, the stadium remained a structural nightmare, and the roof — the centerpiece of the architectural bravado — never quite functioned as promised.
That $1.5 billion, adjusted for today’s inflation, equals the building four Whitney Museums or funding the entire operating budget of the Smithsonian Institution for a year. Despite this lesson, municipal leaders cannot resist a stadium line item in their budgets, chasing the ephemeral sugar high of a Super Bowl or a World Cup, while the quiet, compounding interest of a well-managed museum collection or arts district lies begging.
My general hypothesis for this year’s financial posts is that the question “Where does the money come from?” is the wrong question. Instead, I feel like we should actually ask “How should we allocate the money?” to suggest that the money already exists but is simply not distributed efficiently. To make this point, the data suggests that cultural institutions generate more revenue per dollar of investment than sports stadiums. Far from black and white, however, we should dig deeper into how these projects function in their surroundings and ask if the kind of institution actually dictates the amount of ROI.
$22.12 Avg. return per $1 invested — Cultural institutions
$4.97Avg. return per $1 invested — Sports venues
4.5×Cultural ROI premium over stadiums
The Data
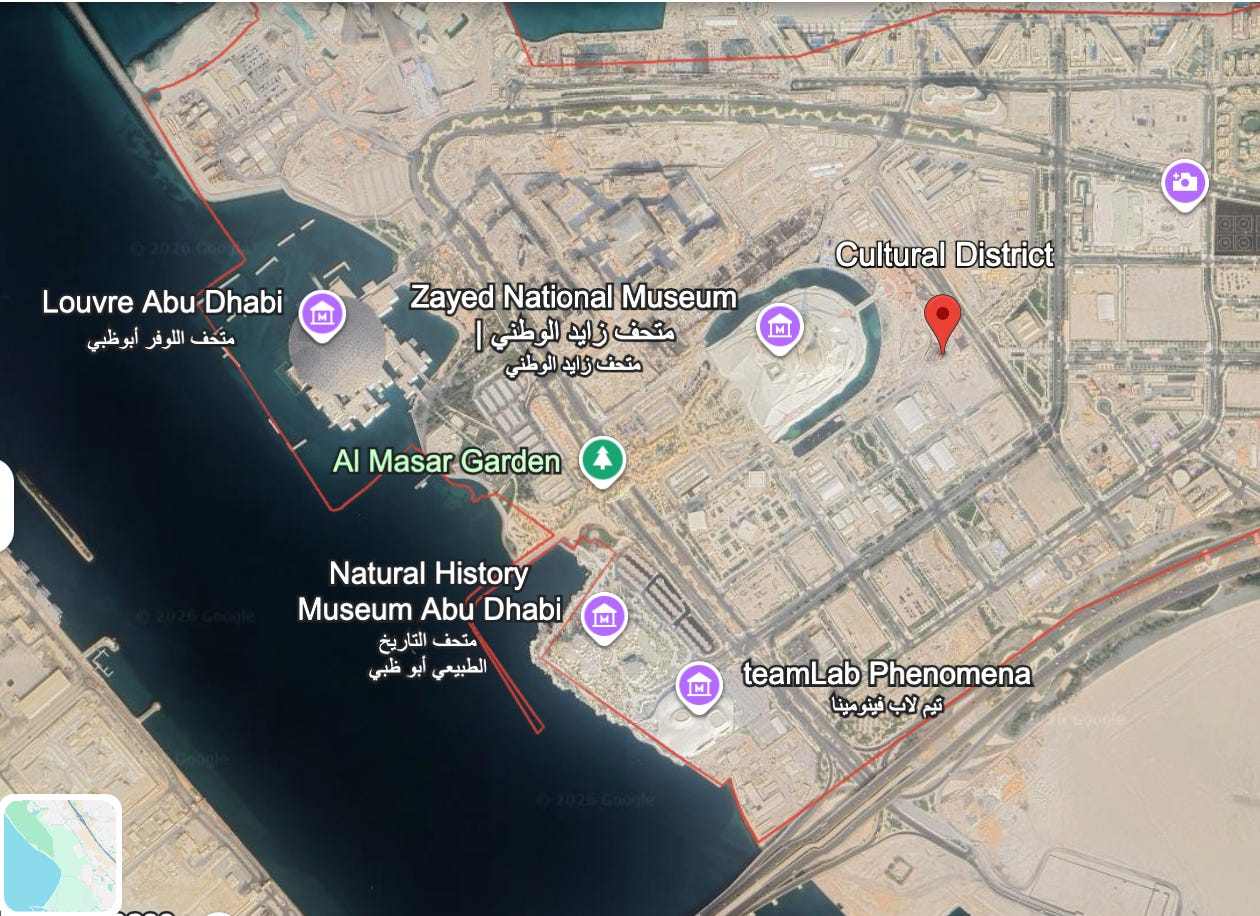
The chart below plots 98 of the world’s most significant public venue investments — 50 sports stadiums and 48 cultural institutions — by their actual build cost against their cumulative ROI (dollars returned per dollar invested, through 2025). I have excluded two projects still under construction or only newly opened: The Cultural District in Abu Dhabi and the Los Angeles County Museum of Art. The pattern is striking, though it requires a nuanced reading.
A few things leap from the chart immediately. First: cultural institutions — represented in orange — cluster predominantly in the mid to upper reaches of the horizontal ROI axis. The Sydney Opera House, built for $102 million and now generating $660 million annually, registers a cumulative ROI of $336 for every dollar invested. The Musée d’Orsay returns $93 per dollar. The Centre Pompidou, $85. These are not outliers gaming a methodology — they are the product of institutions that have operated, drawn visitors, and catalyzed neighborhoods for decades.
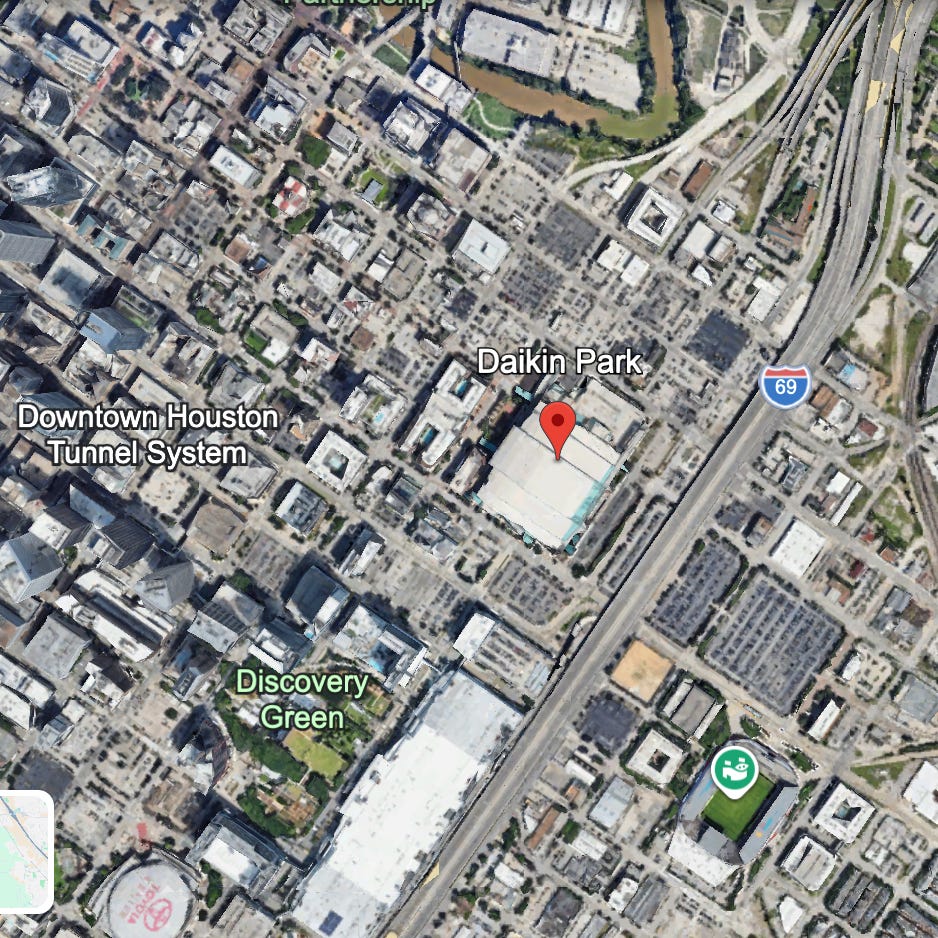
Second: notice that cultural institutions do not fully monopolize high ROI. Paycom Center in Oklahoma City (ROI: $21.72), Fenway Park ($20.67), and Daikin Park ($18.50) all perform admirably and we cannot consider them failures. They are well-located, transit-accessible, year-round venues that function as urban anchors rather than suburban monuments. They prove the point: stadiums per se do not underperform — the model of the isolated, event-only, parking-lot-ringed venue generates the dismal numbers at the bottom of the chart.
The building is never the strategy. What separates the high-ROI outliers from the statistical norm is whether the building was embedded in a pre-existing or deliberately constructed urban ecosystem.
Third, and perhaps most important for this argument: the largest, most expensive stadium projects — Allegiant Stadium ($1.997B build cost, $0.73 ROI), SoFi Stadium ($5.5B, $0.71 ROI), Levi’s Stadium ($1.3B, $1.38 ROI) — cluster in the lower-right quadrant of the chart: high cost, middling return. These are the projects where public subsidy risk is greatest and where the gap between consultant projections and economic reality is widest.
The Stadium Trap: Chasing the Multiplier Mirage
The siren song of the sports stadium hypnotically projects on the municipal Jumbotron and effectively parts taxpayers from their money. Between 1970 and 2020, state and local governments in the United States and Canada devoted $33 billion in public funds to construct major-league sports venues, with the median public contribution covering 73% of construction costs. Despite this massive outlay, the peer-reviewed literature almost universally concludes that sports venues do not generate large positive effects on local economies.
The “substitution effect” explains this outcome. Consumer spending on sports represents a transfer from other local consumer spending, not net-new spending. In other words, if a resident spends $60 on a foam finger, a lukewarm hot dog, and cold soda, they almost certainly do not spend that same $60 at a local pub, restaurant, or gift shop. Furthermore, this “leakage” ensures that much of the money spent in a stadium leaves the community almost instantly.
Adjacent to this phenomena, the wealth of the players also leaks beyond the local community. In the NBA, for example, only 29% of players reside in their host region, meaning their high salaries do not recirculate locally in the way boosters claim. This, however, escapes the frame of this conversation.
Consider the 2004 Athens Olympics. The Greek government built state-of-the-art venues that, by 2012, were shuttered for safety reasons or left to oxidize in the painterly Mediterranean sun. The costs of Olympic Games development have, on average, run beyond estimates by 179% in real terms since 1960. Montreal took 40 years to pay off its 1976 debt. Beijing’s Bird’s Nest — which cost $500 million and shows up in our dataset with a cumulative ROI of just $0.68 — requires $10 million annually just to maintain, and the nest sits largely without eggs. The 10 stadiums built for the 2010 World Cup in South Africa, at a combined cost of over $2 billion, now host a domestic league that averages fewer than 7,000 fans per game in venues built for 51,500.
Economists who scrutinize stadium impact reports find them deeply flawed, regularly overestimating benefits by failing to account for the substitution effect. Some suggest that if you want to know the true impact of a stadium project, you should take whatever number the consultants project and move the decimal point one place to the left.
None of this means cities should not invest in stadiums. It means they should conditionally investment in them under specific considerations. The Battery Atlanta, developed around Truist Park, integrates office space, retail, and residential units to create a year-round destination that does not depend solely on 81 home games. Camden Yards often receives credit for revitalizing downtown Baltimore and inspiring nearly 20 other MLB franchises to build in urban cores. Attendance jumped to over 3 million a year, with 1,750 new housing units and 500,000 square feet of retail built in surrounding areas immediately after completion.
The variable that separates the Paycom Centers from the Fisht Olympic Stadiums? Walkability. Transit access. Year-round programming. Mixed-use surroundings. In other words: an urban ecosystem.
Given the ongoing World Cup, see the 16 host stadiums ranked from moat to merged, from island to integrated.


The Cultural Dividend: What $228 Million Bought Bilbao
When a decaying industrial city in Spain’s Basque country decided in the 1990s to spend $228 million on a Frank Gehry–designed modern art museum, the critics declared it a squandering of public money on the exclusive and the esoteric. The results silenced everyone and prompted many to try to imitate “The Bilbao Effect”.
The Guggenheim Bilbao recovered its initial investment within the first seven years of operation. By 2023, the museum generated total economic demand of €762 million in the Basque Country and contributed €657 million to the GDP. Most strikingly, 87% of its 1.15 million annual visitors arrived from outside the Basque region — making the museum a powerful export engine that injects genuinely new money into the regional economy. This is the precise mechanism that stadium boosters promise but almost never deliver: visitors who came specifically because of the venue, spending money they would not otherwise have spent in that city.
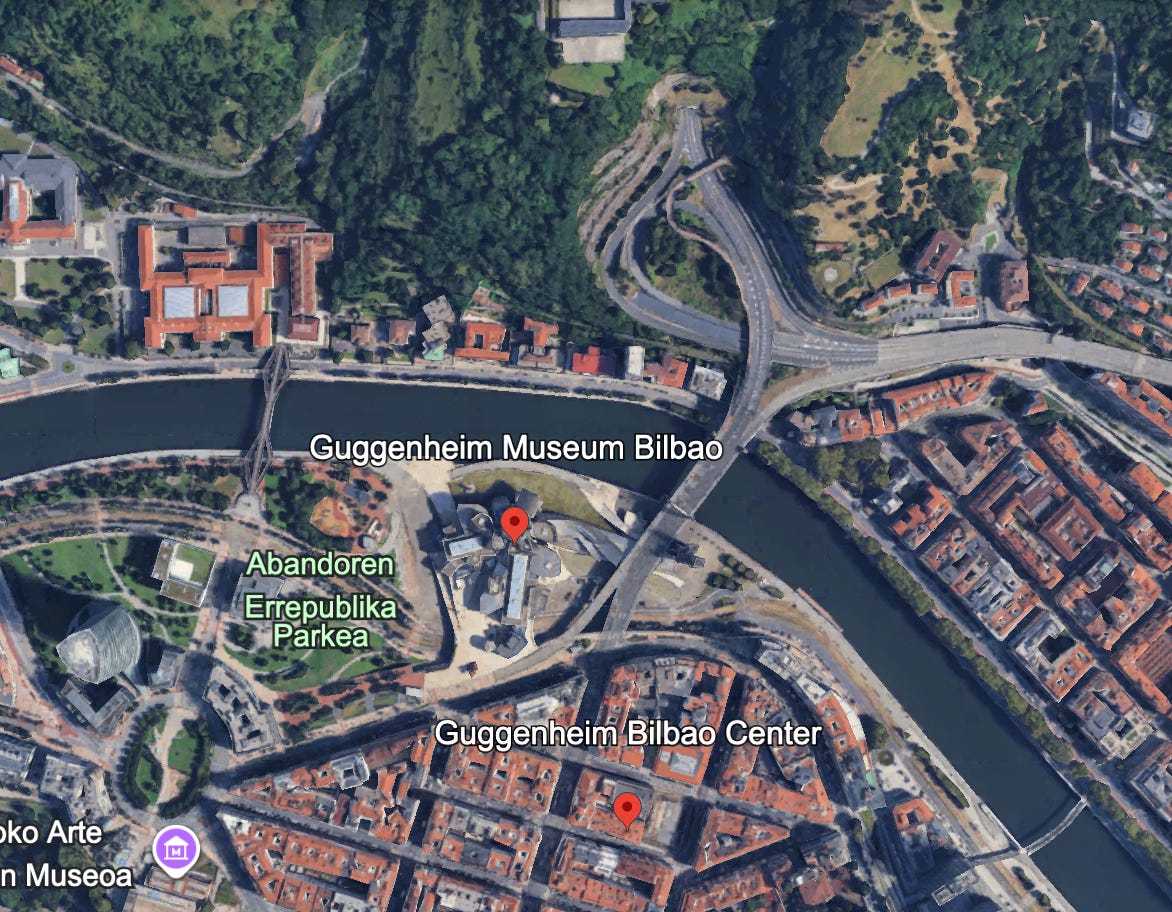
Still, Bilbao taught us more than the headline numbers suggest. The Guggenheim was the catalyst, not the cause. The success sits on a foundation of collaborative urban governance including improvements in transportation, hotel infrastructure, and public spaces that surrounded the building and gave it context. A comprehensive renewal strategy, not a silver bullet dropped into a vacuum, halos the museum and supports its public presence.
This pattern separates the high-performing cultural institutions in our dataset from their lazy counterparts. Researchers have identified five pillars of culturally-led ROI: iconic architecture, genuine cultural investment, measurable economic impact, deliberate urban renewal planning, and a reshaped civic brand identity. Venues that tick all five — Tate Modern, Sydney Opera House, Pompidou — consistently outperform those that tick only one or two. New cultural facilities built in the US between 1994 and 2008 that skipped the urban planning component showed no spillover effects on nearby institutions whatsoever. They copied Bilbao’s aesthetic without replicating its governance.
The Tate Modern and the Quiet Backwater
The Tate Modern’s transformation of London’s South Bank offers perhaps the most instructive case study for American municipal planners. The museum drew an average of 4.5 million visitors per year to an area previously considered a “quiet backwater,” and in doing so gave what researchers called “economic permission” to large-scale commercial and residential developments. Borough Market found its footing. New towers sprouted on the skyline. The museum thusly repriced a once-written-off district.
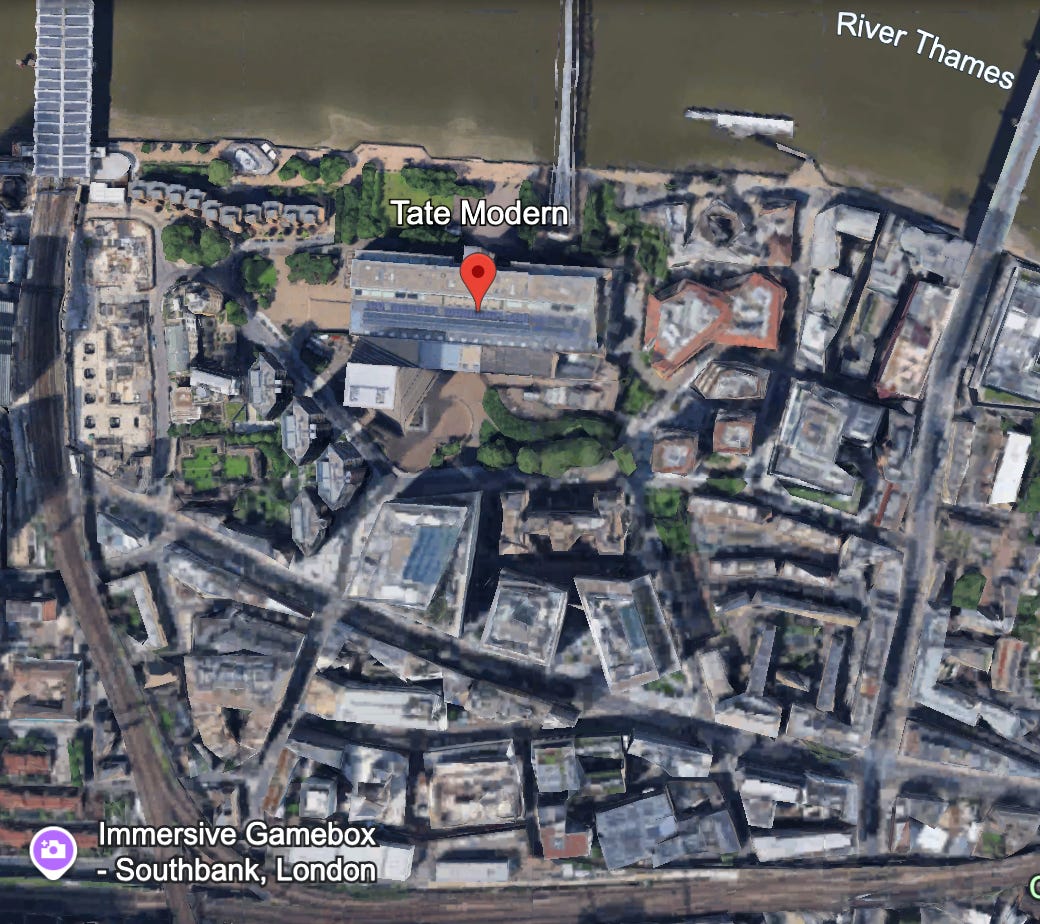
This is the anchor institution concept — a venue which reorganizes urban life around it. A stadium surrounded by a moat of impermeable surface parking resembles Point Nemo for 330 days a year. A cultural institution woven into the city’s fabric operates on a Tuesday in November, runs school programs on Wednesday mornings, and hosts a late-night benefit with DJ Damaged Goods on Friday. It regularly shows up in the city’s life in a way that a team playing 40–80 home games per year simply cannot.
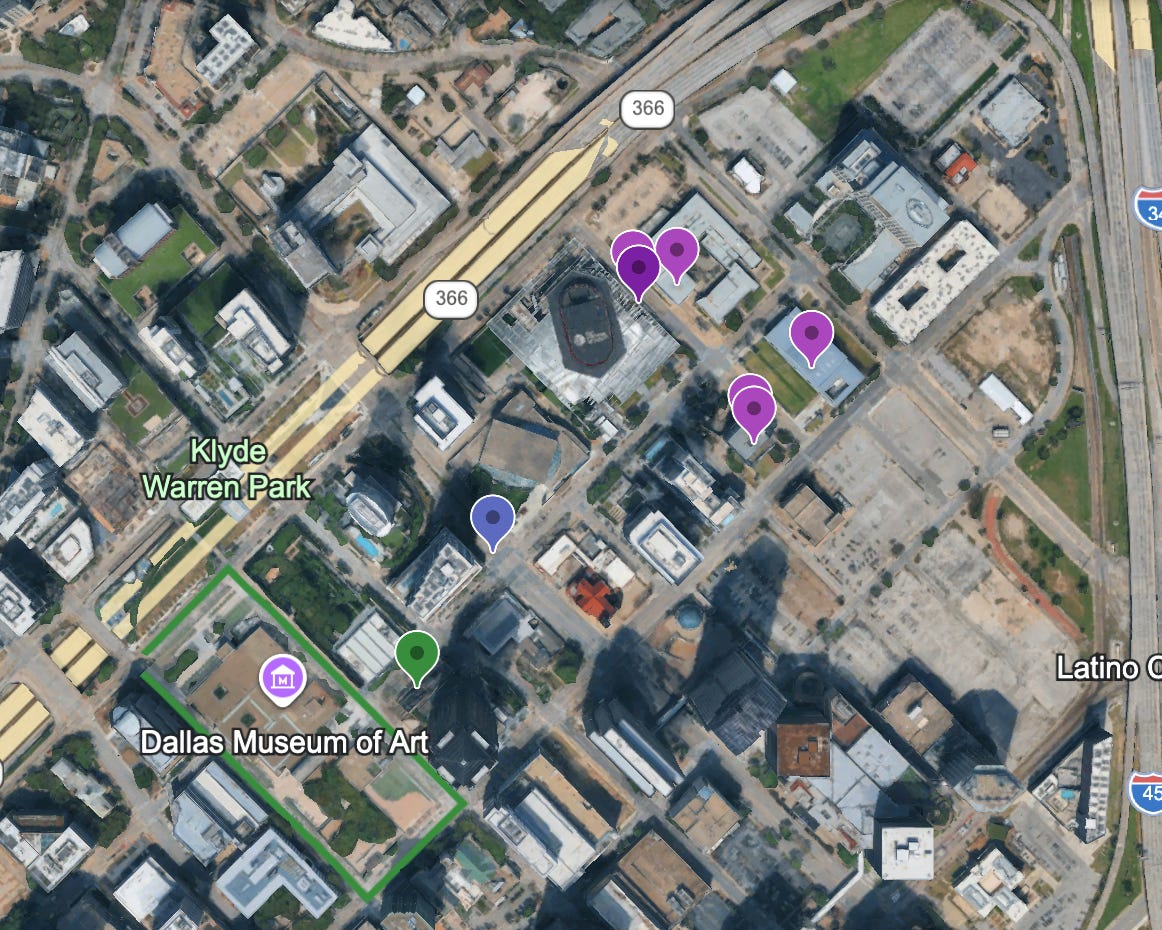
The Dallas Arts District provides the American proof of concept. Funded by a combination of private and public sources, the district generated over $853 million in economic activity and supported nearly 14,000 jobs in 2023 — despite much of the economy suffering from long Covid. Of attendees surveyed, 89.8% said the district inspired “a sense of pride in this neighborhood or community,” and 90.5% said they “would feel a great sense of loss if this activity or venue were no longer available.” Among out-of-town visitors, 92% reported that attending the cultural event was the primary purpose of their trip to Dallas — not a secondary diversion.
The New Paradigm: Sphere, Saadiyat, and the Convergence
We are witnessing a new wave of development that attempts to bridge — or blur? — the categorical divide between stadium and culture. The Sphere in Las Vegas — a $2.3 billion urban UAP that defies easy classification — generated revenues of $1.22 billion in 2025, an 8% year-over-year increase. Its Wizard of Oz immersive experience alone harvested $290 million in ticket sales. The business model mimics a cultural institution far more than a traditional stadium: it relies on consistent programming rather than the erratic schedule of a sports season. It creates an attraction in its own right, regardless of who performs, which is precisely how it avoids the dormancy trap.
In Abu Dhabi, the Saadiyat Island cultural district — distilling the Louvre Abu Dhabi, the forthcoming Frank Gehry Guggenheim, and the Zayed National Museum in a single artsy-fartsy spirit — aims to sow an additional tourism economy. Early (pre Iran-war) data shows that visits to Abu Dhabi’s cultural attractions surged 47% in the first half of 2025. This “cluster strategy” deliberately creates a cultural district wherein the proximity of the institutions amplify the value of each institution and replicates the dynamics of Berlin’s Museum Island or the Dallas Arts District at sovereign-wealth scale.
The Everest of Monetary Gauntlets — and Why We Must Climb It
If the economic evidence is so overwhelmingly in favor of cultural investment, why do municipal leaders continue to be-stadium their budgets? The answer lies in the mechanics of public finance and the political economy of spectacle. Stadium boosters command corporate naming rights worth hundreds of millions. They offer the intoxicating promise of Super Bowl weekends and championship parades. They hire consultants to produce impact analyses that economists consistently find deeply flawed — analyses that project massive returns by failing to account for the substitution effect, the leakage problem, or the simple fact that most stadiums sit empty for the majority of the year.
Cultural institutions, meanwhile, navigate what one arts critic aptly described as an “Everest of monetary gauntlets” that leave in its wake disgruntled, under-compensated employees and underfunded initiatives while a sports team negotiates a sweetheart public subsidy deal. The gap between the public investment we make in spectacle and the investment we make in preservation is not merely a financial injustice; it is a statement of values.
And there is a deeper return that no ROI spreadsheet fully captures. Each additional year of arts education in high school is associated with a 20% reduction in the likelihood of out-of-school suspension. Former arts students are 55% more likely to have attended postsecondary school by adulthood. These are long-term economic gains — increased human productivity, reduced social costs, a higher standard of civic life — that a hockey rink simply cannot manufacture. The museum is not just a building. It is, in the truest sense, social, educations, and physical infrastructure.
“The goal of urban development should not be to build a civic cathedral that sits empty on a Tuesday morning. The goal should be to build a district that is as interesting on a rainy Wednesday in November as it is on a Sunday in October.”
What the Data Tells Us
The average cultural institution in our 100-project dataset returns $22.12 for every dollar invested. The average sports venue returns $4.97. That 4.5× premium is not an argument against stadiums — it is an argument for cultural institutions. It is an argument for the Sydney Opera House, for the Tate Modern, for the next Guggenheim Bilbao that some mid-sized American city with an abandoned industrial waterfront is currently too timid to commission.
The best-performing US stadiums in our data — Paycom Center (Oklahoma City), Fenway Park (Boston), Daikin Park (Houston)— perform as well as they do precisely because they have absorbed the lessons of cultural institution design: urban integration, transit access, year-round activation, a reason for people to attend even when no one throws a ball or scans a ticket. The building is not the strategy. The ecosystem is the strategy.
But a cultural institution comes pre-loaded with the programming diversity that creates an ecosystem. The Tate Modern opens almost every day of the year and runs school trips, evening events, and late-night openings. It wakes up, puts on a suit, and goes to work every day in a way that even a well-designed stadium cannot replicate. When we invest in a cultural institution, we invest in urban permanence. We build something that will not depreciate like a new car just driven off the lot; something that will, in fact, appreciate in cultural value and economic significance every year it stands.
— ✦ —
Sources & MethodologyBradbury, J. C., Coates, D., & Humphreys, B. R. (2022). “The impact of professional sports franchises and venues on local economies.” Journal of Economic Surveys. · Guggenheim Museum Bilbao (2024). 2023 Economic Impact Report. · Matheson, V. (2023). “Stadiums as Public Investments.” EconoFact. · Elpus, K. Arts Education and Positive Youth Development. National Endowment for the Arts. · Sphere Entertainment Co. (2025). Fourth Quarter and Full Year 2025 Results. · Americans for the Arts (2023). Arts & Economic Prosperity 6. · Dallas Arts District / AT&T PAC (2023). Economic Impact Report. · Connecting Travel (2025). “Abu Dhabi’s cultural attractions draw 47% more visitors.” · West Midlands Combined Authority (2023). “Making the Case for Culture.” · ROI dataset compiled from 100 international projects using published financial and attendance reports; ROI = (Actual Annual Revenue × Years Open) ÷ Actual Build Cost.