


The $20,870 Painting and the 70-Cent Fossil
What happens when we ask museums the one question every CFO asks a warehouse: what does it cost you to keep each thing?
The National Gallery in London spends roughly $20,870 per year to steward each of its 2,300 paintings — about the price of a new compact car or a Mr. Brainwash painting annually, per canvas. Across the Atlantic, the Smithsonian Institution spends $9.03 per object — the price of a decent sandwich or a used copy of Sister Wendy Beckett’s The Story of Painting (after tax) — to steward each of its 155 million objects. For what the National Gallery spends on one painting in a year, the Smithsonian stewards more than 2,300 objects. Same profession. Same fiduciary duty. A spread of four orders of magnitude.
Logistics has cost-per-pallet. Hospitality has cost-per-occupied-room. Museums, an industry that similarly exists almost entirely to hold things, have no standard answer to the question “what does it cost to hold a thing?” So let us build one — call it Cost per Object (CPO) — run it against real numbers, and then, in the spirit of full disclosure, explain why the metric will bite anyone who wields it carelessly.
Methodology
I compiled a database of 80 institutions across 65 countries, drawing budget and collection figures from annual reports, government budget documents, and credible secondary sources (the Met’s FY2023/24 annual report, the Smithsonian’s FY2024 Congressional Budget Justification, the Louvre’s Rapport Annuel 2023, and so on — full source list below). CPO divides total annual operating budget by total catalogued collection size. Local currencies convert at approximate 2024 annual average rates. Where institutions disclose expenditure rather than budget, expenditure serves as a proxy.
Note that I have focused on museums because they more readily divulge their data given their often publicly funded bank accounts. Art storage companies1, galleries, and private collections would also benefit from this or adjacent analysis but generally do not spend and tell.
Every caveat in that paragraph is a load-bearing Ionic column supporting the concept. These are estimates, some fiscal years do not align (several UK and Commonwealth figures are FY2022/23), and staff costs for many public institutions required estimation against ICOM sector benchmarks of 40–70% of budget. Treat every number here as directionally dedicated and decimally dubious. With that, the basic premise begins with the formula:
The type of institution is the whole story
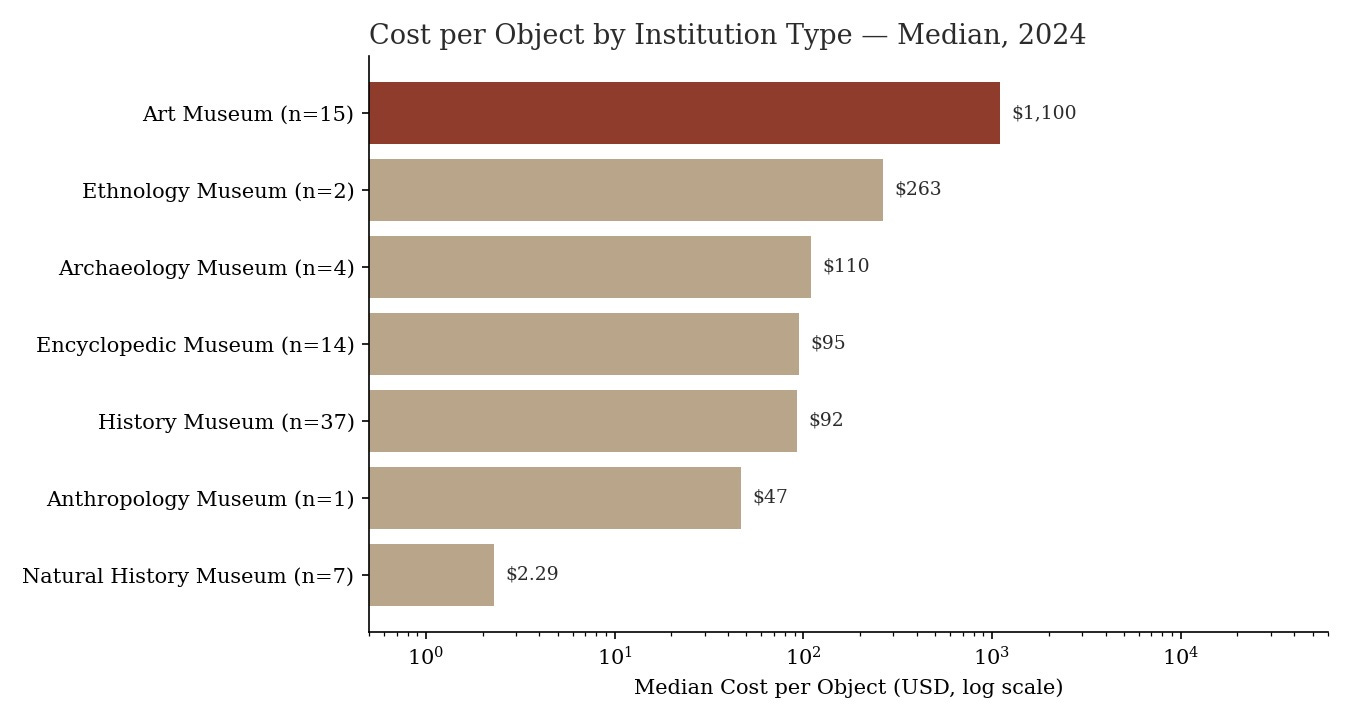
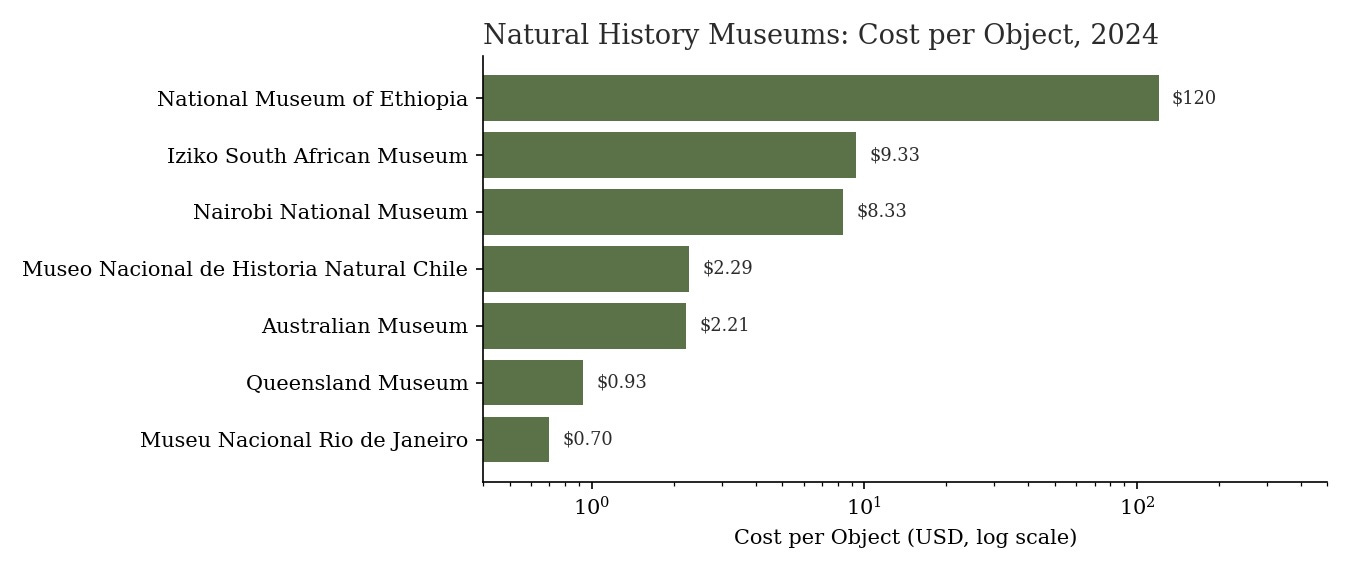
Pool all 80 institutions together and the average is meaningless, because institution type does not merely influence CPO — it determines it. Note the log scale above: the median art museum ($1,100 per object) runs roughly 480 times the median natural history museum ($2.29 per object).
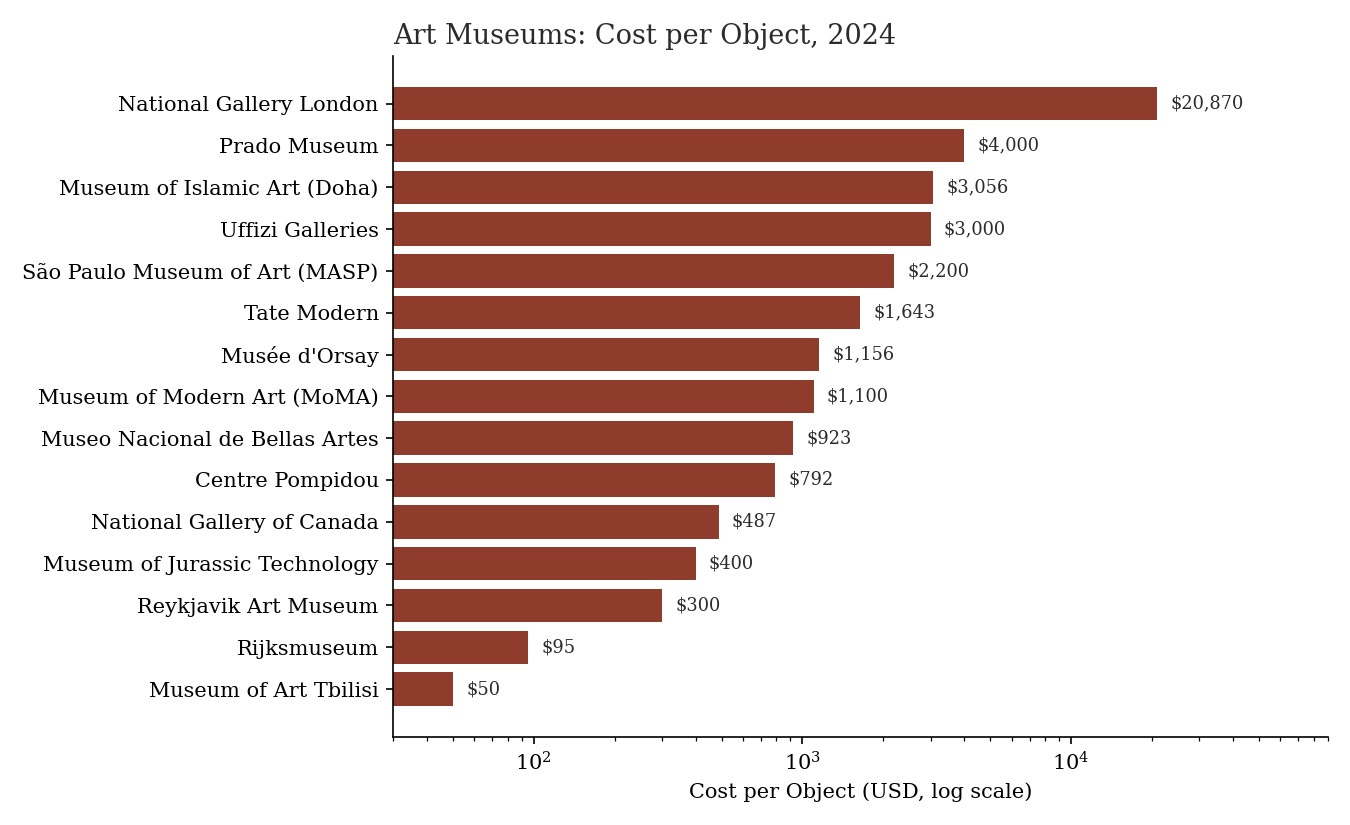
Art museums sit at the expensive end because they hold few objects and spend heavily on each. The art spa known as The Prado indulges about $4,000 per object; the Uffizi, $3,000; the Museum of Islamic Art in Doha, $3,056. The Rijksmuseum ($95) and the Georgian National Museum’s art holdings ($50) prove the category is not monolithic — the Rijksmuseum’s million-object print and decorative arts holdings drag down its CPO like Jar Jar Binks to Natalie Portman in Star Wars.
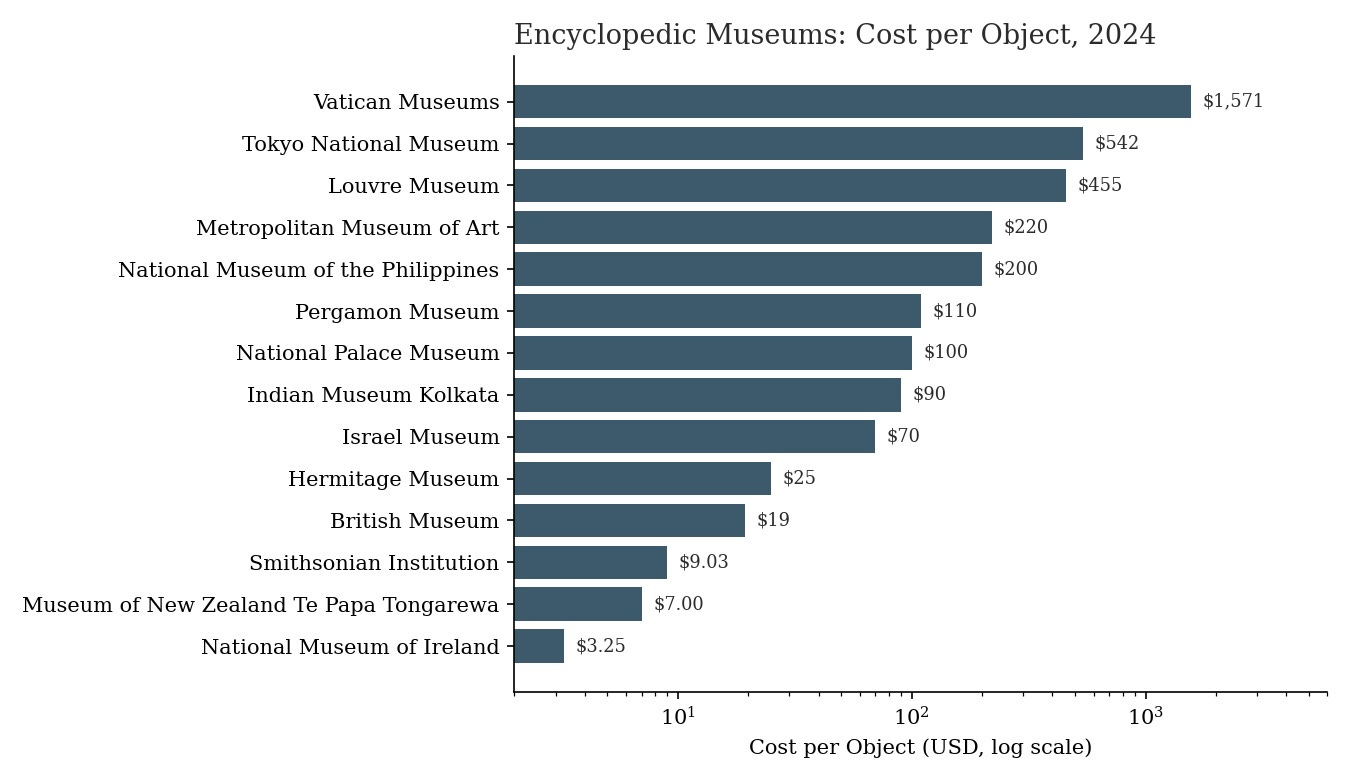
Encyclopedic museums cluster in the middle (median $95), and the internal spread is instructive. The British Museum stewards eight million objects at $19.38 each; the Vatican Museums spend $1,571 per object on a comparatively small 70,000-object collection while turnstiling nearly seven million visitors a year. The Vatican’s number is really a visitor-services budget wearing a white collections cassock2 — the first warning that CPO measures the whole institution, not the storeroom.
Natural history museums are the efficiency champions on paper — Queensland Museum at 93 cents per specimen, the Australian Museum at $2.21 across 21.7 million specimens. A drawer of 10,000 pinned beetles counts as 10,000 objects; a Vermeer counts as one. No conservator would argue they demand equal care.
History museums — the largest cohort at 37 institutions — post a median of $92, but the figure conceals the widest geographic variance in the dataset.
Geography inverts your expectations
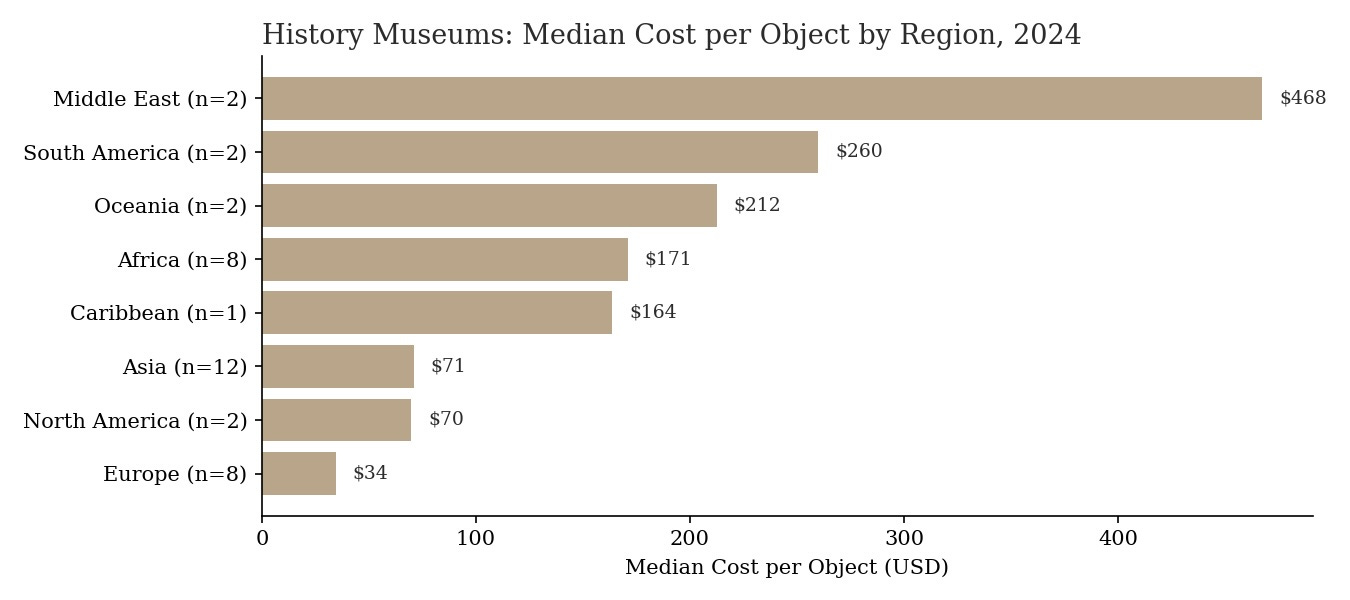
Here is the counterintuitive finding: among history museums, wealthy Europe posts the lowest median CPO ($34), while the Middle East ($468), South America ($260), and Africa ($171) post the highest. These regions typically do not spend more per object — their museums simply hold smaller collections relative to even modest budgets, while European national museums sit atop centuries of accumulated holdings numbering in the hundreds of thousands. The denominator, not the spending, drives the geography. (Small sample sizes in several regions — the Middle East cohort is two history museums — demand humility here.)
The Label Lie
To call an institution a “history museum” or an “art museum” flatters our filing instincts more than it describes reality. The Rijksmuseum holds paintings and literally a million prints; the Georgian National Museum shelters art, archaeology, and natural history under one accession sequence. So rather than assign each institution a single median and pretend the label explains it, plot the whole field as a matrix — institution type down one axis, CPO band across the other — and let the overlaps speak.
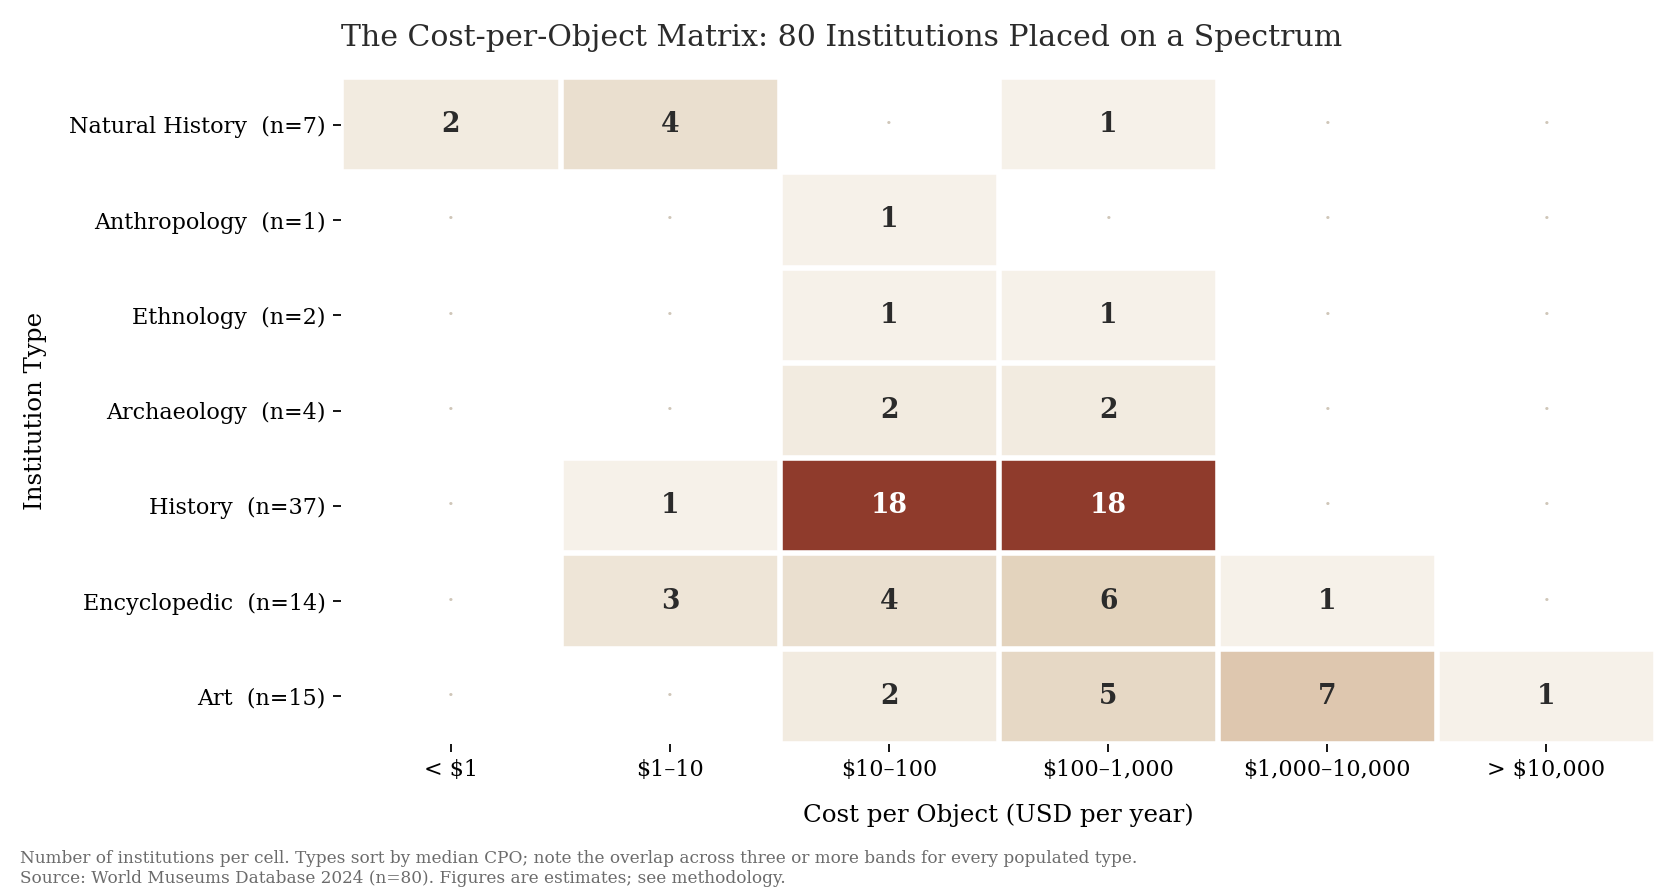
Read the rows and the diagnosis changes. Every populated type spans at least two bands and most span three or four. Encyclopedic museums stretch from the National Museum of Ireland at $3.25 to the Vatican at $1,571 — a 480-fold range inside a single label. Art museums, supposedly the expensive category, place two institutions (the Rijksmuseum) in the same $10–100 band as the British Museum and the Hermitage. History museums split perfectly down the middle, eighteen and eighteen, across the two central bands.
The matrix therefore reframes the exercise. As they say “Ask not what an art museum’s CPO should be given its institutional type? Ask ‘What should be my institutional type given my correctly adjusted CPO.” Thus, the Rijksmuseum’s peers, for benchmarking purposes, are encyclopedic museums — not The Prado. That reframing alone justifies the metric, whatever its flaws. And the flaws are considerable.
The [Unexpected] CPO law
The intuition runs thus: art museums spend more per object because their objects are worth more, and value summons cost through insurance, security, and conservation. It is a tidy hypothesis. The data support the shape of it and demolish the mechanism.
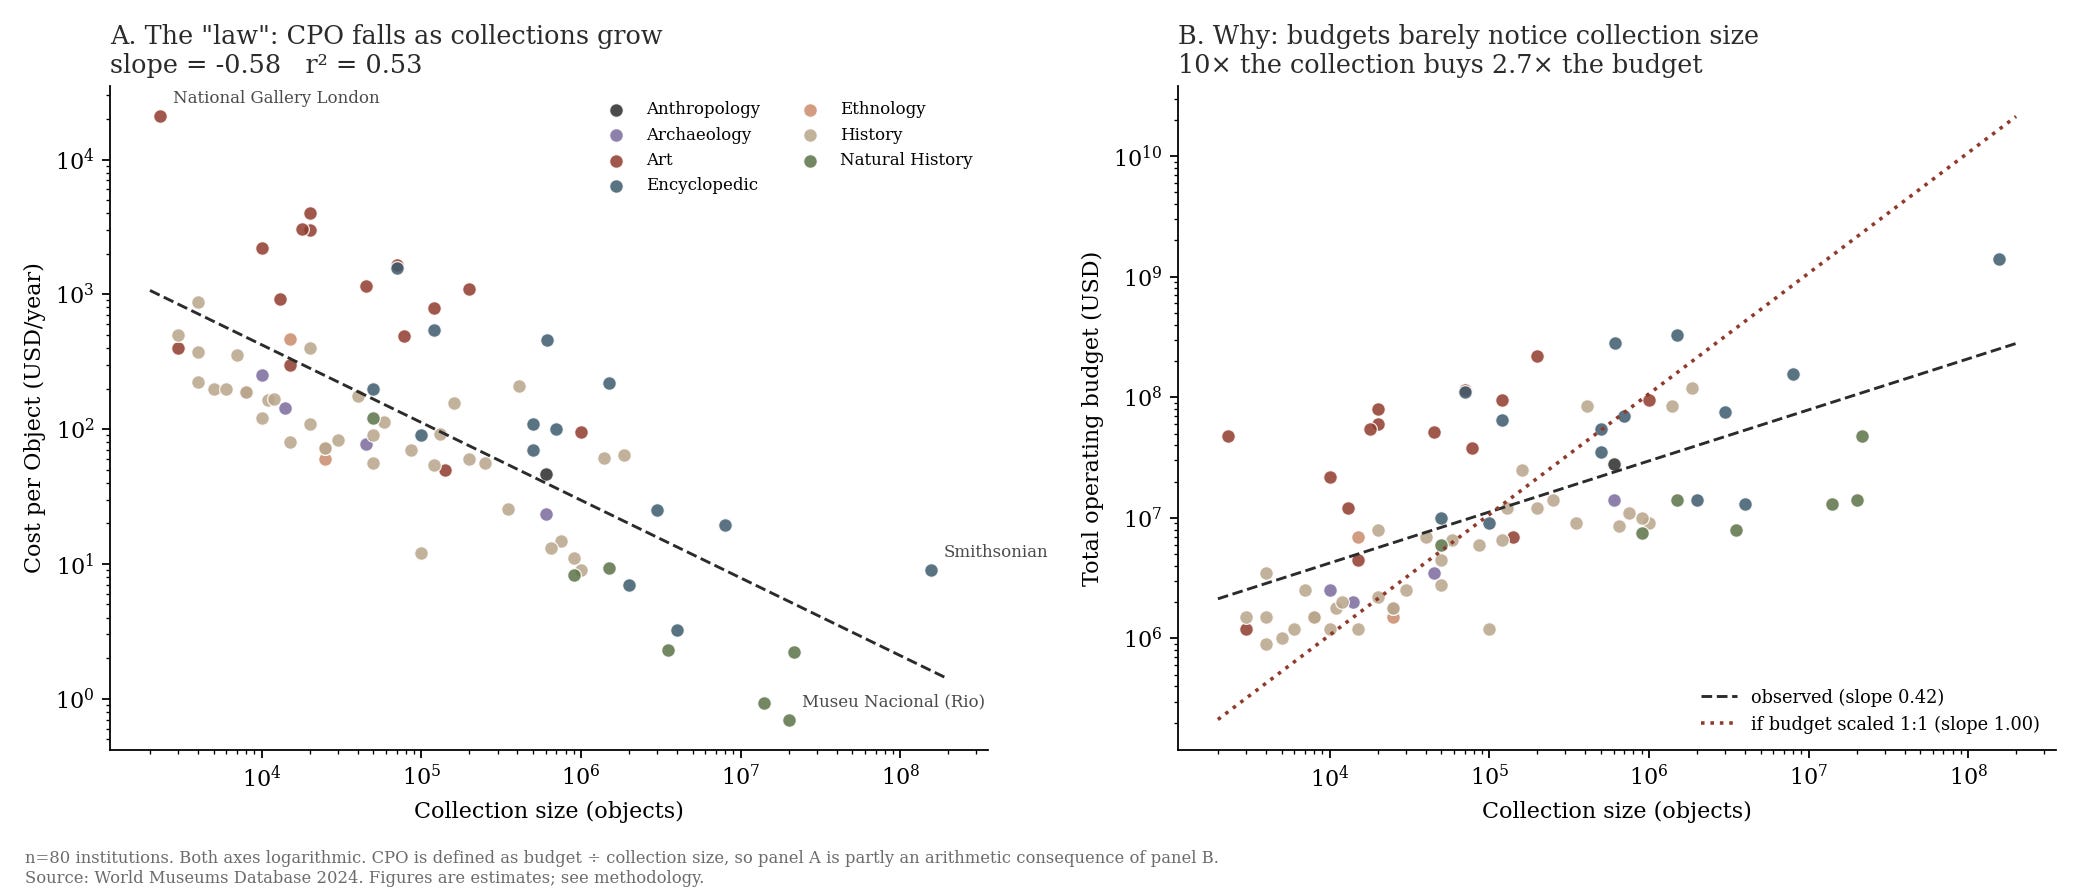
The inverse relationship is real and it is strong. Regress CPO against collection size across all 80 institutions and the log-log slope lands at −0.58 with an r² of 0.53 (Spearman rho −0.70, p < 0.001). (I’m taking the AI’s word on this one.) Collection size alone explains rather more than half the variance in what museums spend per object. Call that a law if you like — but read the fine print first.
Size explains it all, right? The inverse relationship carries an unstated and most likely overly simplistic implication about physical scale: collections grow numerous largely by accumulating small things — beetles, coins, prints, potsherds — while small collections stay small because their objects occupy more real estate. Cost per object therefore smuggles in a size variable that nobody measures. No sector-wide data on collections storage volume exists to test this; ICOM's global survey on collections in storage records how full museum stores are, not how many cubic feet they contain. Until someone counts the cubic feet, the size effect remains a plausible confounder rather than a demonstrated one.
Half the “law” is arithmetic, not economics. We fundamentally define CPO as budget divided by collection size, so any variable placed opposite N inherits an inverse relationship by construction. The honest test is the other panel: how do budgets themselves scale with collection size? The answer is the real finding. The elasticity (here we go again with the math) is 0.42 (95% CI ±0.12) — meaning a museum with ten times the collection commands only 2.7 times the budget. Collection sizes in this dataset span 4.8 orders of magnitude; budgets span only 3.2. Museums do not fund objects. They fund buildings, staff, and visitors, and the objects come along for the ride.
The insurance mechanism largely does not exist. Precisely the institutions holding the highest-value collections rarely pay commercial premiums on them. The United Kingdom’s Government Indemnity Scheme covered 26,433 items worth £19.1 billion in 2024–25, saving borrowing museums roughly £81 million against commercial cover, and national institutions sit outside conventional insurance entirely because the state already carries the risk. Thus the Velázquez paintings in the Prado do not hoist the data into a disproportionally higher CPO. Market value, in the public museum sector, is a number for the insurance policy and the loan agreement — not for the ledger.
So what does the residual measure? Strip out collection size and art museums still run 6.5 times richer than their size predicts; encyclopedic museums 2.3 times; natural history museums a mere 0.26 times. Type genuinely adds something. But that something correlates tellingly with self-generated income: art museums earn a median 58% of their budget commercially against 27% for natural history museums, and the size-adjusted budget residual tracks the self-funding ratio at rho 0.46 (p < 0.0001). The extra money in a high-CPO museum flows toward the visitor-facing enterprise — galleries, guards, cafés, blockbusters — not toward the object.
State the law properly, then: CPO scales inversely with collection size at roughly N^−0.6, because museum budgets track attention rather than accession numbers. Objects on display cost money. Objects in drawers cost comparatively little, which is exactly why they wait so long for a conservator.
Now for the Problems
First, the denominator is a fiction we all agree to. Some institutions count items; others count lots. “Catalogued objects” excludes backlogs, which every registrar knows can rival the catalogued collection itself. A museum that diligently catalogues looks less efficient than one that does not — the metric punishes the virtue it should reward.
Second, the numerator is not a collections budget. Total operating budget bundles exhibitions, education, security, and the café. CPO is honestly an institutional-intensity metric, not a collections-care metric. A true version would isolate collections-care spending, which almost no institution reports separately — itself a finding worth an essay.
Third, and most damning: the cheapest museum in the dataset is the one that burned. The Museu Nacional in Rio de Janeiro posts the lowest CPO on Earth — 70 cents per object — across the roughly 20 million objects that survived its catastrophic 2018 fire, a disaster investigators tied directly to chronic underfunding. If your KPI awards first place to the museum that lost most of its collection to deferred maintenance, your KPI measures starvation and calls it efficiency. Optimize CPO too aggressively downward and you risk converting your collection to kindling.
The Formula
For those of you brave enough to run this when you get back to the office, everything above collapses into a four-step calculation. It requires no data a collections manager does not already possess.
Step 1 — Fix the denominator. Do not use the catalogue. Use everything you hold:
N = catalogued objects + estimated backlog
κ (cataloguing coverage) = catalogued ÷ N
Report κ beside every figure that follows. An institution at κ = 0.6 is not comparable to one at κ = 0.98, and the metric otherwise rewards the museum that never catalogues.
Step 2 — Compute the raw figure.
CPO = B ÷ N, where B is total annual operating expenditure
Step 3 — Adjust for scale. This is the step that makes the number mean anything. Because budgets scale as roughly N^0.42, raw CPO falls automatically as collections grow, and comparing a 2,000-object gallery to an eight-million-object museum compares arithmetic rather than stewardship. Normalize both to a common reference collection of 100,000 objects:
CPO* = CPO × (N ÷ 100,000)^0.58
Read it as: what this institution would spend per object if it held 100,000 of them. The adjustment works — across the 80 institutions here, CPO* retains essentially no correlation with collection size (rho 0.03, p = 0.76) and compresses the spread from 4.5 orders of magnitude to 2.3.
Step 4 — Locate yourself against peers, not against the field3.
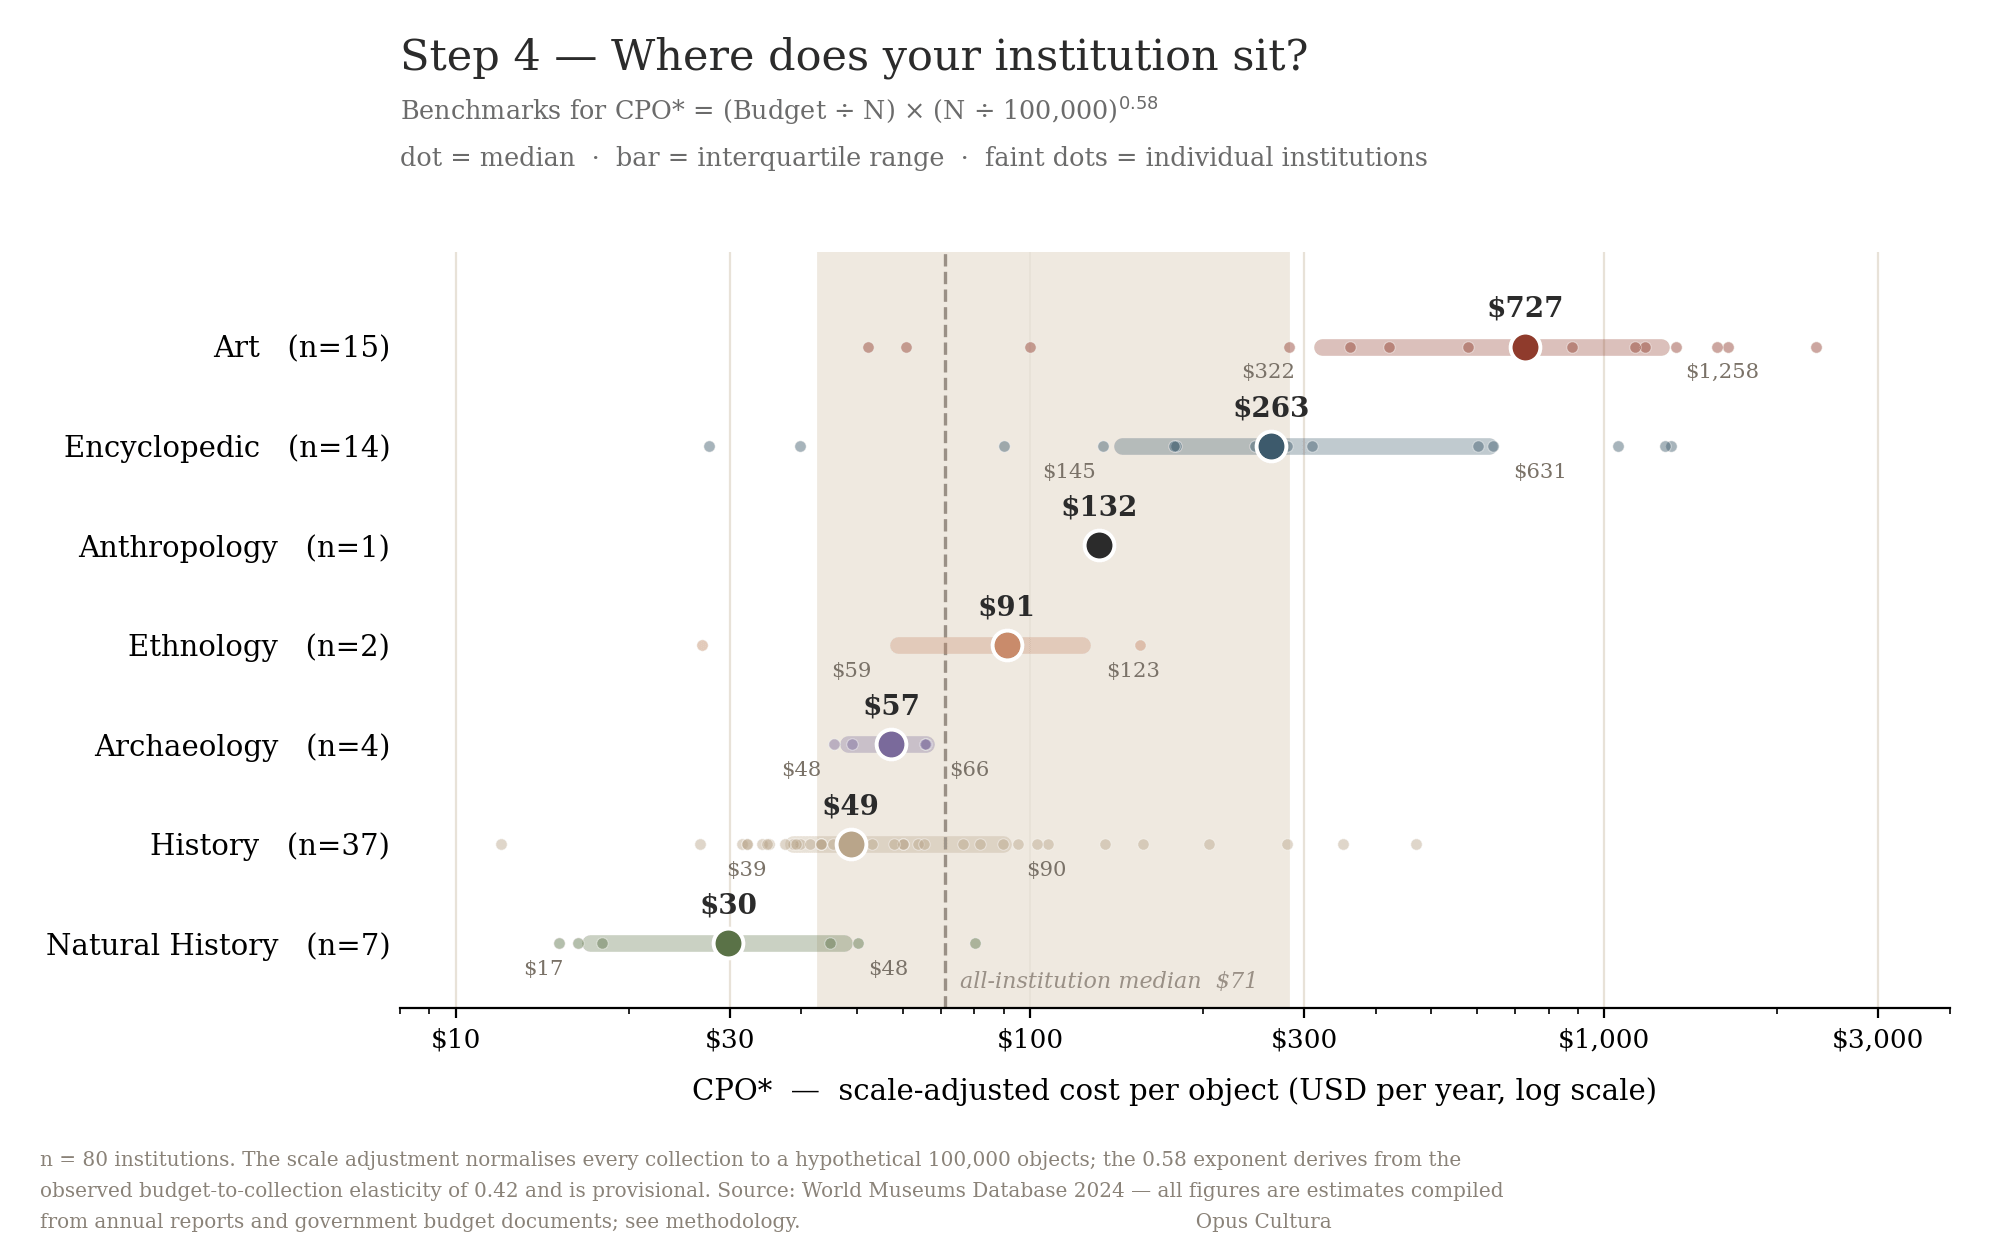
And one diagnostic, not a correction. Alongside CPO*, report σ = earned revenue ÷ total budget. Size-adjusted spending tracks self-funding at rho 0.46 (p < 0.0001): art museums earn a median 58% of budget commercially against 27% for natural history museums. A high CPO* paired with a high σ signals visitor-facing intensity — galleries, guards, blockbusters. A high CPO* paired with a low σ signals something rarer and more interesting: an institution genuinely spending on stewardship.
The adjustment rearranges the league table, which is precisely the point. The Smithsonian posts the second-lowest raw CPO in the entire dataset at $9.03 and looks like a model of thrift. Adjust for its 155 million objects and its CPO* climbs to $640 — well above the British Museum ($246) and the Rijksmuseum ($361). The Smithsonian is not a marathon runner with zero body fat. It is enormous, and enormity flatters the raw metric. Conversely the National Gallery falls from an absurd $20,870 to $2,341 — still the highest in the set, still worth explaining, but no longer a number that ends conversations.
The Final Formula4
Look, I do not pretend to be a mathematician and, thus, to understand this the way a colt knows how to walk at the time of birth. Please reach out if this you can improve this metric.
So keep CPO — but use it the way a conservator uses a hygrothermograph: as a trend line, not a trophy. Track your own institution’s CPO over time, within your general type, and interrogate every movement in the denominator. The moment a board member proposes benchmarking your CPO against another museum’s, hand them this article and point to Rio on the map.
Sources
Museu Nacional/UFRJ post-fire rebuilding budget documents, 2024
Iron Mountain — Q4 2025 Supplemental Financial Information (segment storage rental revenue, global storage volume by segment, storage rental gross margin)
Full 80-institution database, methodology notes, and exchange-rate table: World Museums Database 2024 (compiled workbook; figures are estimates drawn from the primary sources above and government budget documents — verify against primary sources before financial or academic use)
Data note: all figures FY2023–24 where available, converted at 2024 average exchange rates. Collection counts mix items, lots, and specimens; treat cross-institutional comparisons as directional.
Further, I used AI to compile and distille this data. This approach provides me access to things I would not otherwise know about or think to look for. Handicap that as you best befits you.
What the Market Charges, When It Bothers to Tell You
The commercial sector solves the denominator problem by refusing to count objects at all. Crozier Fine Arts, the world’s largest art logistics firm and a subsidiary of the publicly traded Iron Mountain (NYSE: IRM) since 2015, never discloses how many objects it holds — a sensible position, given that the number changes every time a collector consigns a Rothko or a gallery de-installs a fair booth. Crozier instead meters the variable that stays put: space.
Iron Mountain’s Q4 2025 supplemental filing reports $71.8 million in storage rental revenue for its “Corporate and Other” segment, which houses the Fine Arts business, against 7.17 million cubic feet of stored volume — roughly $10.00 to $10.65 per cubic foot per year, depending on whether one divides by year-end or average volume. Compare that to the $3.18 billion the company earns storing 736.8 million cubic feet of ordinary business records, or about $4.35 per cubic foot — meaning the art premium runs a mere 2.4 times the rate for a banker’s box of your university’s admission records from 1987–1988.
Two details deserve a registrar’s attention. First, Iron Mountain books a 70.5% gross margin on storage rental across the enterprise, which suggests that the actual cost of holding a cubic foot of art sits well below what anyone pays for it.
Second, Crozier’s storage volume has grown 34% since late 2023 while its revenue per cubic foot has drifted downward from roughly $11.30. Like that conditioner in your shower, it appears that the firm has volumized its way to growth rather than pricing its way there.
Caveat the whole calculation appropriately: the segment bundles Fine Arts with Iron Mountain’s IT asset disposition business, so the isolation is imperfect, and revenue per cubic foot measures what the market charges, not what stewardship costs. Still, the contrast instructs. A museum in the database above spends a median of $92 to $1,100 per object per year to keep its collection alive. A commercial custodian charges ten dollars per cubic foot to keep someone else’s collection dry, dark, and profitable.
Do not fear, I looked this up, too. It is a long, ankle-length, close-fitting robe worn by clergy. When worn by the Pope, it is specifically a white cassock. I thought that you should know.
What Kind of Institution am I? Do not consult your mission statement, your governing legislation, or the word carved in stone above the lobby door. Sort your entire holdings and ask what the median object looks like — not the treasure on the poster, but the ten-thousandth item down the accession list. That single question sorts institutions far better than any label. The Rijksmuseum calls itself an art museum, yet its median object is a print in a solander box rather than a Rembrandt, which is exactly why it benchmarks alongside the encyclopedic museums at $361 rather than beside the Prado at $1,573. A county historical society whose median object is a photographic negative belongs on the History row; the same society, if it holds mostly furniture and agricultural implements, belongs somewhere nearer Ethnology. Institutions that straddle two rows should simply calculate against both and report the range, because an honest interval instructs a board more reliably than a false decimal.
Definitions:
B — total annual operating expenditure. Not the collections budget, because almost no institution reports one. This is the metric’s central compromise and its most honest weakness: BB B bundles exhibitions, security, education, and the café alongside conservation. CPO* therefore measures institutional intensity per object, not stewardship per object.
NN N — every object you hold. Not the catalogue. A museum that diligently catalogues its backlog watches its CPO* fall, which means the metric punishes the very virtue it ought to reward unless you count the uncatalogued material too.
NcatN_{\text{cat}} Ncat and NbackN_{\text{back}} Nback — catalogued objects and estimated backlog. Separating them lets you report κ\kappa κ, below, and forces an estimate that most institutions avoid making out loud.
κ\kappa κ — cataloguing coverage. An institution at κ=0.6\kappa = 0.6 κ=0.6 is not comparable to one at κ=0.98\kappa = 0.98 κ=0.98. Publish it beside every CPO* figure or the comparison is theatre.
$100{,}000$ — the reference collection. An arbitrary but fixed anchor. It converts CPO* into a plain-language question: what would this institution spend per object if it held one hundred thousand of them? Changing the anchor rescales every figure but preserves the rank order, so pick one and never move it.
$0.58$ — the scale exponent, and the entire point of the formula. Museum budgets rise as roughly N0.42N^{0.42} N0.42: ten times the collection commands only 2.7 times the budget. Raw cost per object therefore falls automatically as collections grow, and comparing a two-thousand-object gallery to an eight-million-object museum compares arithmetic rather than care. The exponent $0.58$ (which is $1 - 0.42$) cancels that effect out. It derives from 80 estimated budgets and remains provisional — treat it as roughly 0.6 and recalculate it as better data appears.
σ\sigma σ — self-funding ratio. A diagnostic, never a correction. Size-adjusted spending tracks earned income at rho 0.46: art museums earn a median 58% of budget commercially against 27% for natural history museums. A high CPO* with a high σ\sigma σ signals visitor-facing intensity — galleries, guards, blockbusters. A high CPO* with a low σ\sigma σ signals something rarer: an institution genuinely spending on stewardship.